


More – not less – democracy is often better for organising a World Cup
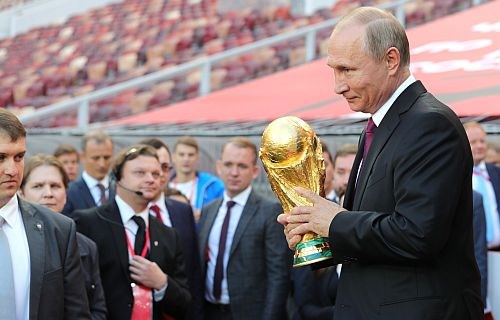
The last FIFA World Cup was hosted by Russia in 2018. In the picture we see president Vladimir Putin at the 2018 FIFA World Cup Trophy Tour kick-off ceremony. Photo: Kremlin.ru
29.11.2019
By Matthias Fett , Helmut-Schmidt-University in HamburgIn 2013, the then-FIFA Secretary General Jérôme Valcke unsettled the audience at a symposium when he stated: “I will say something crazy, but less democracy is sometimes better for organising a World Cup”. And he continued: “When you have a very strong head of state who can decide, as maybe Putin can do in 2018, that is easier for us organisers than a country such as Germany where you have to negotiate at different levels. It’s quite difficult to organise a World Cup in such conditions.”
A controversial opinion, especially considering that in the last two decades a number of more autocratic countries has been awarded hosting rights of sport mega-events, like the Olympic Games or the World Cup: The Summer Olympic Games in Beijing 2008, the Winter Olympic Games in Sochi 2014, the 2018 FIFA World Cup in Russia and the upcoming FIFA World Cup 2022 in Qatar. The awarding of the European Games by the European Olympic Committee (EOC) to Azerbaijan and Belarus supports this trend.
The reasoning for Valcke’s claim also seems plausible. As an outside organisation FIFA is favouring an efficient organisational structure when organising the world’s biggest football tournament. The quadrennial Men’s World Cup is FIFA’s main revenue source. In the period from 2015 to 2018, they generated more than 70 per cent of their revenue in the World Cup year of 2018 alone (4.6 of 6.4 billion USD). According to the FIFA Financial Report 2018, FIFA would be in deficit without the Men’s World Cup overcompensating the expenses in the non-event years. Therefore, a politically neutral FIFA primarily needs a reliable host country that can deliver the tournament a) in time (to fulfil sponsorship agreements) and b) without complications (to promote the tournament for further negotiations). But is it then really ‘better’ to award the World Cup to less democratic countries?
Defining a good outcome
In order to answer that question, we first need to define, what ‘better’ means for FIFA and in general. ‘Good’ for FIFA would be no losses in the period between two World Cups, and therefore ‘better’ is any result, where the revenues are higher than the tournament costs. An additional criterion can be that the tournament costs should then be as low as possible.
In general, the public also has an interest in positive outcomes for the hosting society. Just like FIFA, the public wants to see that the benefits outweigh the costs.
While FIFA and the local organising committee (LOC) bear the tournament costs, the host country bears 100 per cent of infrastructural expenditure and often also the stadium construction costs. Another aspect that has become more relevant, especially since 9/11, is event security, which further increases the cost side. Difficult to quantify, because of security and other cost factors linked to World Cup projects, but nevertheless of economic importance are also opportunity costs. These are the costs of a foregone investment or the ‘benefit’ of the first-best alternative.
Benefits of an event can be a modernised infrastructure, a positive image of the country and its people, and an increase in life quality. Most of these factors can be quantifiable through a change in GDP per capita.
Second, a definition of ‘democratic’ countries is needed. Every year, the Freedom in the World reports from Freedom House rate the political rights and civil liberties in 195 countries on a scale from best (1) to worst (7) for each of these two categories. Using the political rights index from the event year, the host countries from 1974 onwards fall into three groups:
Group 1= a score of 1: West Germany, Italy, USA, France, Japan, and Germany.
Group 2 = a score of 2: Spain, South Korea, South Africa, and Brazil.
Group 3 = a score higher than 2: Mexico (4), Argentina (6), and Russia (7).
World Cup economic successes
Testing the hypothesis that less democracy is better for FIFA, the first criterion was: ‘No losses for FIFA’. FIFA has only released annual financial reports from 2002 onwards, so it is only possible to ascertain financial gains and losses from organising the World Cups in the new millennium (2002-2018). To make comparisons easier, figures from FIFA’s annual financial reports over the years have been converted into 2018 US Dollar values and they show that in 2002 FIFA made a loss of 2.63 million USD, while the other event years were profitable: 311.04 million USD (2006), 232.32 million USD (2010), 150.89 million USD (2014) and 1,750 million USD (2018).
The big difference between the 2018 result and the other years can be attributed to a number of reasons such as the inaugural FIFA eWorld Cup, an increase in licensing rights, and an unexpected rise in broadcasting rights, mainly driven by the Asian and North African territory and the 2015 FIFA scandal, which presumably postponed negotiations and final agreements. Therefore, the World Cups in Germany 2006, South Africa 2010, Brazil 2014 and prominently Russia 2018 can be considered successes.
The price of a World Cup
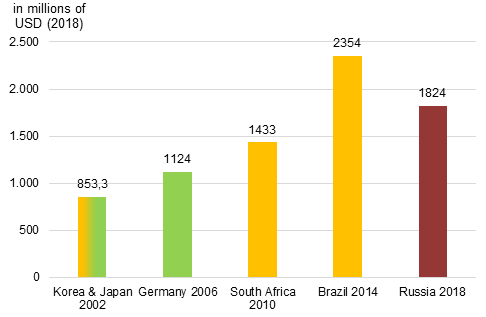
The second criterion for a successful World Cup was low tournament costs. Here, there seems to be a steady development with one strong outlier (see Figure 1). This strong outlier is Brazil 2014, where the tournament costs were higher than 2.3 billion USD. On the other hand, Germany 2006 cost FIFA about 40 per cent less than Russia 2018, thereby contradicting Valcke’s initial claim.
Figure 1. FIFA World Cup Tournament Costs (2002-2018) in 2018 USD values.
The costs to the public
For the public, the overall cost dimension plays a bigger role. Fortunately, there is more information available (see Table 1). Public investment into stadiums is relatively higher in developing economies than in developed economies, resulting in a higher burden for the national budget, that will be added to the urban transformation costs. The urban transformation is probably the most prominent cost factor and figures are available from 1974 onwards. Only the two Mexican World Cups remain without data. In the 1970s and 1980s, Argentina 1978 is the outlier, as dictator Jorge Rafael Videla invested about 10 per cent of the national budget into the World Cup because he believed “hosting the World Cup was the national duty of the highest priority”. Italy 1990, on the other hand, suffered from an 84 per cent cost overrun. USA 1994 did not have these problems as they could rely on the existing infrastructure. Since 2014, costs for urban transformation exceed 10 billion USD.
In addition to these figures, comes the security costs of the tournament. While Germany spent about 30 million USD in 2006, South Africa invested 174 million USD, and Brazil 874 million USD. A former study on the 2018 FIFA World Cup, based on numbers from the Olympic Winter Games in Sochi 2014, estimated security expenditures at 11 billion USD.
This raises the question of possible high opportunity costs, which in part can only be seen and measured in a couple of years. But protests in Brazil and Russia show that the consequences can already be felt in public life.
Table 1. Stadium construction costs and Urban Transformation for the World Cups 1970-2018 in 2018 USD values.
|
Event |
Stadium Costs |
Urban Transformation |
|
Russia 2018 |
5 billion |
≥ 11 billion |
|
Brazil 2014 |
4.8 billion |
≥ 14 billion |
|
South Africa 2010 |
2.05 billion |
4.85 billion |
|
Germany 2006 |
2.27 billion |
2.58 billion |
|
Korea & Japan 2002 |
5.29 billion |
5.24 billion |
|
France 1998 |
1.263 billion |
1.3 billion |
|
USA 1994 |
0 |
0 |
|
Italy 1990 |
≥ 362.87 million |
3.69 billion |
|
Mexico 1986 |
N/A |
N/A |
|
Spain 1982 |
118.15 million |
0.9 billion |
|
Argentina 1978 |
N/A |
2.69 billion |
|
West Germany 1974 |
114.15 million |
0.5 billion |
|
Mexico 1970 |
N/A |
N/A |
The more democracy is better
The final criterion should answer the question whether the benefits outweigh the aforementioned costs. A means to quantifying the benefits is to apply a modified economic growth model on the specific World Cups. Based on statistical models previously presented at Play the Game, the change in the annual GDP per capita growth rate is measured.
The specific FIFA World Cup hosting effect compared to all other countries that have ever participated in the World Cup is measured and controlled for other relevant macroeconomic variables such as consumption, education, and inflation. Due to data availability, only the World Cups from 1974 onwards can be observed, whereas the data on Brazil and Russia are not complete and have to be interpreted cautiously. The results are presented in Table 2:
Table 2. Change in annual per capita GDP rate (1974-2018).
|
Event |
Change in annual per capita GDP growth rate |
|
Russia 2018 |
-1.006 |
|
Brazil 2014 |
-1.413 |
|
South Africa 2010 |
+0.769 |
|
Germany 2006 |
+0.188 |
|
Korea & Japan 2002 |
+2.728***/+2.094** |
|
France 1998 |
+2.603*** |
|
USA 1994 |
+0.836 |
|
Italy 1990 |
+1.836** |
|
Mexico 1986 |
-3.266** |
|
Spain 1982 |
-9.651*** |
|
Argentina 1978 |
-1.617 |
|
West Germany 1974 |
-10.44*** |
*** = significant to the 1%-level, ** = significant to the 5%-level, * = significant to the 10%-level.
By looking at the table various trends can be observed. There is a significant difference in the results in the periods before and after 1990. The significant negative trend can be attributed to previous findings in the sport mega-event literature. Surprisingly, Argentina has an insignificant negative outcome, even though it spent a relatively higher percentage of the national budget on hosting the World Cup than countries like Germany or Spain. Overall, before 1990, the FIFA World Cup could be classified as a ‘major’ not ‘mega-event’, and therefore certainly did not have such an influence on German or Spanish GDP growth. In these cases, the oil crisis (West Germany) or the transition phase after the Franquisme towards the European Market in Spain can be attributed to the negative trend of per capita GDP seen in table 2. More interesting are the findings after 1990. Until 2014 the results are positive and sometimes even statistically significant. For Brazil and Russia, one can assume that the high urban transformation costs and subsequent opportunity costs harmed the economy already in the host year.
Based on the classification and the criteria above, it can be concluded that democracy plays a crucial role in at least hosting the FIFA World Cup. Considering the criteria for FIFA, a more democratic country is less costly in the organisational process, but also in the tournament costs itself. From the societal perspective, democratic countries seem to perform better economically in the host year than less democratic or autocratic countries. Reasons for this cannot be solely attributed to the FIFA World Cup, but the claim of Valcke needs to be overturned as costs are reduced on each side and a non-negative legacy of the tournament can be created. To put it in his terms: More democracy is often better to organise a World Cup.