


Analysis
The unpredictable financial costs of hosting the Olympic Games
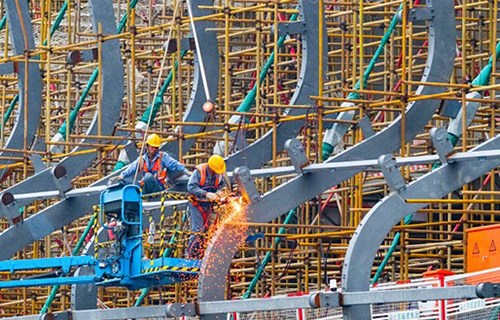
The IOC and academics disagree on how costs for constructing a speed skating stadium like this for the 2022 Beijing Winter Olympic Games should count towards the final costs of hosting Olympic Games. Photo: Liu Shuaiye/Getty Images
23.02.2021
(Updated 3 March 2021 to include information received from the IOC)
As the troubled 2020 drew to a close, Japanese taxpayers learned about the costs of postponing the Tokyo 2020 Olympics by one year due to COVID-19: According to the organisers, a price tag of an extra 2.8 billion USD will be added to the already sky-rocketing costs. Two-thirds of this bill will be paid by public coffers.
The increase in costs of the Olympic Games in Tokyo cannot solely be blamed on its postponement. The planning of the Games is traditionally subject to extreme uncertainty which results in large cost overruns, and Tokyo is no exception according to Japan’s National Audit Board.
In December 2019 – before the postponement to 2021 – the bid committee projected that the Olympics would cost 12.6 billion USD, while Japan’s National Audit Board assessed that the final price of the Olympics would increase to over 22 billion USD with approximately 75 per cent coming from public funding. This is well over the bid committee’s projected total costs of just 7.3 billion USD when they were awarded the Games in 2013.
A recent publication has reignited the debate about the costs associated with hosting the Olympics. An academic paper from 2020 with the title ‘Regression to the Tail: Why the Olympics Blow Up’ has examined cost overruns for Olympic Games since 1960, and it was immediately criticised heavily by the International Olympic Committee (IOC) who argues that the study mixes different budgets and attributes non-Olympic costs to the Olympic budget.
The dispute continued with open letter from the lead author of the study, professor Bent Flyvbjerg, to IOC president Thomas Bach, where Flyvbjerg responded to seven points of criticism from the IOC. The purpose of this article is to examine the claims and counter-claims between the IOC and Flyvbjerg to uncover whether any of the criticisms voiced by the IOC are valid.
The Olympic cost overruns from 1960 to 2016
The paper by Flyvbjerg, Budzier and Lunn published in September 2020 examines cost overruns at the Olympics from 1960-2016 considering (1) operational costs incurred by the Organising Committee for staging the Olympic Games and (2) direct capital costs for building the sports-related infrastructure required to host the Games.
The study does not count indirect capital costs for broader infrastructure, such as roads, railways, airports, hotel upgrades, etc. The authors argue that even though the indirect capital costs are often substantially higher than the direct costs, it is difficult, and often impossible, to obtain valid and reliable data. Further, a large part of the indirect capital costs – e.g. building a new underground system – will typically occur whether the Olympic Games are staged or not but perhaps at a later point in time.
The authors compare the expected costs from the Candidature Files ("bid books") – which are submitted to the IOC by prospective host cities roughly eight years before the Games – to the total costs in post-Games reports.
They find that every Winter and Summer Olympics since 1960 has run over budget by an average of 172 percent varying from 2 to 720 percent with actual costs varying from 22 million USD to 21.9 billion USD in 2015-prices (see table 1).
Table 1: Total costs and cost overrun (%) of Olympic 1960-2016 (Flyvbjerg et al., 2020; p. 27-29)
|
Olympics |
Country |
Type |
Cost overrun (%) |
Cost, billion USD (2015) |
|
Rome (1960) |
Italy |
Summer |
N/A |
N/A |
|
Squaw Valley (1960) |
United States |
Winter |
N/A |
N/A |
|
Tokyo (1964) |
Japan |
Summer |
N/A |
0.282 |
|
Innsbruck (1964) |
Austria |
Winter |
N/A |
0.022 |
|
Mexico City (1968) |
Mexico |
Summer |
N/A |
N/A |
|
Grenoble (1968) |
France |
Winter |
181 |
0.888 |
|
Munich (1972) |
Germany |
Summer |
N/A |
1.009 |
|
Sapporo (1972) |
Japan |
Winter |
N/A |
0.117 |
|
Montreal (1976) |
Canada |
Summer |
720 |
6.093 |
|
Innsbruck (1976) |
Austria |
Winter |
N/A |
0.118 |
|
Moscow (1980) |
Soviet Union |
Summer |
N/A |
6.331 |
|
Lake Placid (1980) |
United States |
Winter |
324 |
0.435 |
|
Los Angeles (1984) |
United States |
Summer |
N/A |
0.719 |
|
Sarajevo (1984) |
Yugoslavia |
Winter |
118 |
N/A |
|
Seoul (1988) |
South Korea |
Summer |
N/A |
N/A |
|
Calgary (1988) |
Canada |
Winter |
65 |
1.109 |
|
Barcelona (1992) |
Spain |
Summer |
266 |
9.687 |
|
Albertville (1992) |
France |
Winter |
137 |
1.997 |
|
Lillehammer (1994) |
Norway |
Winter |
277 |
2.228 |
|
Atlanta (1996) |
United States |
Summer |
151 |
4.143 |
|
Nagano (1998) |
Japan |
Winter |
56 |
2.227 |
|
Sydney (2000) |
Australia |
Summer |
90 |
5.026 |
|
Salt Lake (2002) |
United States |
Winter |
24 |
2.520 |
|
Athens (2004) |
Greece |
Summer |
49 |
2.942 |
|
Turin (2006) |
Italy |
Winter |
80 |
4.366 |
|
Beijing (2008) |
China |
Summer |
2 |
6.810 |
|
Vancouver (2010) |
Canada |
Winter |
13 |
2.540 |
|
London (2012) |
United Kingdom |
Summer |
76 |
14.957 |
|
Sochi (2014) |
Russia |
Winter |
289 |
21.890 |
|
Rio de Janeiro (2016) |
Brazil |
Summer |
352 |
13.692 |
Flyvbjerg and his colleagues show that cost overruns for the Games are subject to extreme uncertainty and randomness and the authors argue that it is only a matter of time before cost overruns at the Olympics will rise to unseen heights.
It leaves nations and cities bidding to host the Olympics in difficult circumstances because planning and budgeting come with an extreme risk of considerable cost overrun. The authors suggest that potential bidders for the Olympics should ask themselves the following questions:
- "Can we afford and accept a 20 percent risk of a three-fold increase or higher in cost in real terms on the multi-billion-dollar expenditure for the Olympics? If the answer to this question is yes, then proceed and become a host; if the answer is no, walk away."
- "Can we afford and accept an expected cost overrun in the range of 170-750 percent in real terms on the multi-billion-dollar expenditure for the Olympics, with substantial risk of further overrun above this range? If the answer to this question is yes, then proceed and become a host; if the answer is no, walk away, or find effective ways to "cut the tail," i.e., reduce tail risk."
They further suggest ways to improve management and mitigate risk based on the identification of six drivers behind cost overruns at the Olympics:
- Irreversibility: Unlike most other investment projects, it is difficult to abandon the Games even if it would be the rational decision.
- Fixed time schedules: It is not possible to reduce costs by extending the time of the project.
- Tight coupling: The size, structure and quality of the project are often defined by the requirements of the sports which leaves little to no room for cost reducing changes.
- Long planning horizons: The long planning horizon increases the risk of negative impact from random events.
- The Blank Check Syndrome: The IOC has no incentive to reduce costs because the host is legally bound to cover cost overruns.
- Eternal Beginner Syndrome: As the host changes for each Olympic Games, they are often inexperienced in managing projects of this size and complexity.
Critique from the IOC
Shortly after the paper was published, the IOC attacked the study on the news site Insidethegames as well as on Twitter. Much of the IOC’s criticism was not directed at the publication’s content and ignored that the study solely focuses on costs and that it only covers the period from 1960-2016. Instead, the IOC put forward a number of other criticisms including
- the study mixes the budget for the organisation of the Games (operational costs), and the infrastructure budgets of the city, region, and country (capital costs).
- that the study suggests that infrastructure budgets (capital costs) serve only the four weeks of the Olympic Games competition and must be 'written off' immediately afterwards.
- the publication 'Cost and Revenue Overruns of the Olympic Games 2000-2018' by Preuß,and Weitzmann (2019) found that all Games editions investigated since 2000 have either broken even or turned a profit.
(After we published this article, the IOC made us aware that they later updated the wording of their criticism to read that the study "found that all the Organising Committees for which data is available, and which run the operations of the Games and are almost entirely privately funded – including a significant contribution from the IOC – have either broken even or turned a surplus.”)
In the following, we will discuss these three claims from the IOC and the responses from Flyvbjerg in his open letter to the IOC (where he addresses the concerns as point 1, 2, and 7).
Mixing budgets
The IOC states that the authors mix the budget of the organisation of the Games (operational costs) and the infrastructure budget (capital costs). Flyvbjerg responds that:
"…our numbers include only the direct sports-related costs of the Games. The wider infrastructure budgets of the city, region and country – which, as you know, are often several times higher than the sports-related costs – are left entirely out of our numbers…".
Although Flyvbjerg states in his response that they exclude broader infrastructure costs from their analysis, they still mix operational costs and the sports-related capital costs, which are compiled into one budget (total sports-related costs). In this sense, the IOC is right when they claim that the study mixes budgets. Considering Flyvbjerg's formulation, it is likely that he has misunderstood the claim put forward by the IOC to only be a matter of sports- and non-sports related costs. We have asked Flyvbjerg if we are right in assuming he has misunderstood the IOC but in an email he explained that he did not have time to reply to our question within our deadline.
We have also asked Flyvbjerg why the study does not specify the operational costs and sport-related capital costs separately. To do that would have been informative to the reader, and it is also likely that the two budgets would behave differently in terms of cost overruns. However, despite it being standard practice, it is not mentioned in the study whether they have run separate models for the two types of costs. Flyvbjerg did not have time to respond to this question either.
Further, it is not apparent from the paper which of the individual budget lines from the candidature files and post-Games reports that have been allocated to the organisation of the Games and the sports-related infrastructure, respectively. To get a better understanding of this issue, we asked Flyvbjerg for a detailed list of the division of the budget lines from 2000-2016. Flyvbjerg replied that unfortunately he and his co-authors did not have the time to go back and find the material.
Capital costs are only ascribed to the Olympic Games
The IOC further critiques the paper for suggesting that the infrastructure budget (capital costs) only serves the four weeks of the Olympic Games and must be written off immediately afterwards. Flyvbjerg responds that "our study does not state this. In fact, we have not expressed this view anywhere."
What the IOC likely suggests with their criticism is that only some of the capital costs for infrastructure should be attributed to the Olympic Games because (a) some of the facilities will be built regardless of the staging of the Olympic Games and/or (b) the investments are of benefit after the Games. Hence, if all capital costs are ascribed to the Games, it will overestimate its total costs. In contrast, if all capital costs are left out of the Olympic budgets, total costs will be grossly underestimated.
But is it possible to know in advance how much of an Olympic stadium's costs that should be accredited to the four weeks of Olympic activities?
In a few cases, a professional sports team might 'take over' the arena after the Games – typically on a favourable deal that does not match the capital costs – and fill it occasionally. In many cases, there is little demand for high-capacity arenas, resulting in what has been termed 'white elephants' (see for example the World Stadium Index report). In these cases, incremental (Olympic) costs should arguably account for close to 100 percent of the total costs.
Although Flyvbjerg responds that he and his colleagues do not state that the capital costs should be written off immediately after the Olympic Games, the paper de facto treats all sports-related infrastructure as a proportion of total Olympic costs.
Hence, if not all the sports-related capital costs should be recognised as Olympic expenses, the total costs in table 1 may be overestimated. This approach is, however, not different from the approach used in the candidature files until 2014 where bidding cities did not separate between Olympic ('Games incremental costs’) and non-Olympic costs.
Further, it should be appreciated that the study is concerned with cost overruns and in this sense, what is important is the relative difference between projected and actual costs, and not how they should be divided into Olympic and non-Olympic costs.
Do all Olympic Games (at least) break even?
Last, but not least, the IOC initially stated that according to a study by Preuß, Andreff & Weitzmann from 2019, all Olympic Games since 2000 have either broken even or generated a profit (which they later changed to 'all Organising Committees) to which Flyvbjerg responds, "We respectfully ask you to confirm or repudiate that the IOC funded this study" insinuating that their results should be met with strong scepticism. Strangely, Flyvbjerg et al. do not refer to this study in their paper. In an e-mail correspondence, Holger Preuß told us that the IOC Olympic Studies Centre has supported the research with €30,000 (read more about the Olympic Studies Centre).
Like Flyvbjerg and his team, Preuß’ group examines cost overruns, but also the Organising Committees' revenue overruns at the Olympic Games from 2000-2018. Despite using different methodologies, both studies report (severe) cost overruns for the Games (see table 2). Additionally, Preuß et al. finds that not just costs, but also the Organising Committees’ revenues are systematically underestimated.
Indeed, the authors only focus on whether the Games are profitable from the perspective of the Organising Committee and not the city or the country as a whole. The study states that "For all 10 Games editions, we found that the costs of organising the Olympic Games (OCOG budget) are usually covered by revenues…" (see Executive Summary, p. X).
Table 2: Both studies report severe cost overruns at the Olympics since 2000
|
|
Flyvbjerg et. al (2020) |
Preuß et. al (2019) |
|
|
|
Operational and direct capital cost overruns |
Operational cost overruns |
Direct capital cost overruns |
|
Sydney (2000) |
90% |
51% |
56% |
|
Salt Lake (2002) |
24% |
114% |
28% |
|
Athens (2004) |
49% |
30% |
29% |
|
Turin (2006) |
80% |
58% |
20% |
|
Beijing (2008) |
2% |
4% |
* |
|
Vancouver (2010) |
13% |
12% |
13% |
|
London (2012) |
76% |
48% |
43% |
|
Sochi (2014) |
289% |
-6% |
178% |
|
Rio de Janeiro (2016) |
352% |
** |
** |
|
Pyeong-Chang (2018) |
** |
24% |
** |
*No direct capital costs were included.
**No final figures were available at the time of writing.
The local Organising Committees of the Games may indeed have generated a profit, including subsidies in various forms. However, as all sports-related (and wider) capital costs are left out of the equation, it is highly doubtful that hosting the Games benefits the economy as a whole. Generally, economists concerned with the impact of the Olympic Games agree that hosting does not have a significant effect on economic measures such as GDP, income or overall employment.
Yet, as we see it, the IOC does have valid points when stating that (1) Flyvbjerg and his colleagues mix operational and (sports-related) capital costs and (2) assume that the (sports-related) infrastructure only serve the four weeks of the Olympics. While it is possible that cost overruns behave differently for the operation of the Games and (sports-related) capital costs respectively, the division of costs into Olympic and non-Olympic, however, seems irrelevant with respect to the study’s overall conclusions.
Andreas Nygaard is a junior analyst and Christian Gjersing Nielsen an analyst at the Danish Institute for Sports Studies, both specialised in economics.